In this post, we will walk through an example in order to understand and define how to apply 1 and 2 qubit operations on a state described by a graph or, more generally, a hypergraph as described in our previous post.
We will build the famous Bell State.
The Initial State
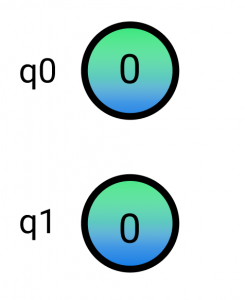
Most quantum systems start off in the initial (all zeros) state. This is a simple state to represent with the graph concept we introduced in the previous post. We only need a graph with 2 nodes representing the |0> state:


For the sake of simplicity, we will leave complex numbers and some of the details like the bra-ket notation parked for a moment.
1-Qubit Gates: The Hadamard
In order to apply a 1-qubit operation to the graph, we simply apply it using the conventional matrix multiplication method for the node associated with the qubit we are working with. In this case, we will apply a Hadamard gate to q0 which will take us from the |0> state to the |+> state.

Note that so far the nodes are not connected. This is because the qubits are separatable and not entangled.
2-Qubit Gates: The Controlled-Not
Controlled operations are another beast. The difficulty in representing a transformation that reflects the impact of a gate like the CX gate on the graph is that we need to represent the possible correlation such gate can create. Because the control qubit is in superposition we know the CX will result in entanglement but how can we intuitively implement that?
Here is where the classical interpretation of controlled gates from our first post in this series comes in handy. “if the control qubit is 1, apply the X gate to the target qubit”. We can think of controlled operations as edge-splitting operations. If the control is in superposition, the CX gate will split the edge in 2 in order to capture the two possible measurable outcomes |00> or |11> in this case. The node in the |+> state has now split into 2 nodes with corresponding 0 and 1 values and the X gate has only been applied to q0 when connected to a control node in the |1> state.
For simplicity, we are ignoring what happens with the amplitudes associated with the original |+> state (we’ll get to it with time) and we also align the nodes in the resulting graph in such a way that the bottom nodes all belong to qubit 0 and the bottom ones to qubit 1.

Now we have multiple nodes per qubit that represent the fact that we can’t anymore describe each qubit independently. We really can’t describe their separate states other than just treating them as a mixture of 0 and 1. What this graph is conveying is that if we measure one qubit to be in a given state, we will immediately know in which state the other qubit is because they are connected via an edge. They are correlated.
How do we Evolve an Entangled State?
Nothing really changed in the nature of the graph. It’s still a graph and therefore we can still manipulate it by applying gates as described above. In order to apply an additional Hadamard gate to q0 we just need to extend the definition and apply it to all the nodes related to q0 turning them into the + and – states respectively.

How do we disentangle this mess? In the next post, we will talk about edge simplification and expansion and how another CX gate will destroy entanglement.
For more market insights, check out our latest quantum computing news here.


