
Quantum Market Sizing Dataset
Vendor-revenue market model for quantum computing, 2025 to 2035, by segment, geography, and vertical, with bear, base, and bull scenarios, economic impact, and triangulation against 12 external estimates.
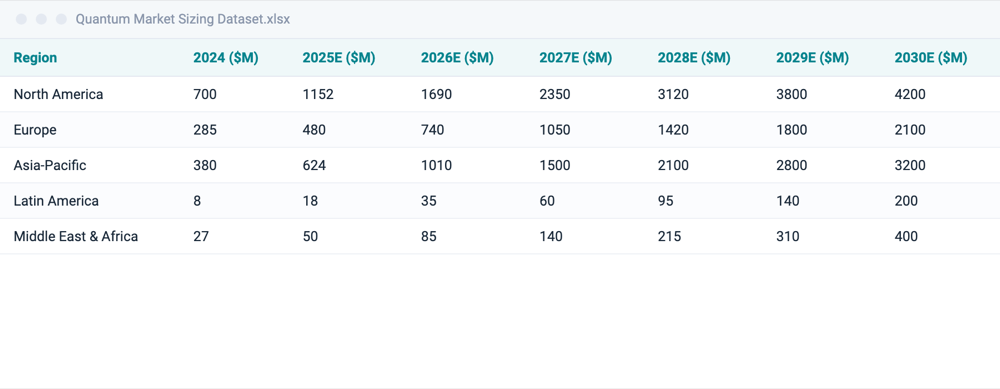
- Records
- 11 model sheets exported to one long-format table
- Coverage
- 2025 to 2035, base year 2025
- Geography
- Global with Americas, EMEA, and APAC splits
- Update cadence
- Semiannual
- Last updated
- Q3 2026
- Format
- Excel model and PDF report
- Single license
- $2,999
- Corporate license
- $5,999
How you can use it
One named user at your organization, for internal work.
Everyone at your organization, and use in deliverables for your own clients.
One-time purchase, not a subscription.
This is the data only. It does not include access to the TQI Intelligence Platform.
Both licenses permit the citation Source: The Quantum Insider. Neither permits redistributing the workbook, reselling the data, or publishing the full tables.
Delivered by email link as an Excel workbook and a PDF briefing. Invoice or payment link on request. Purchase orders accepted.
How this was built and who reviewed it
This is analyst work, not a machine summary.
- TQI market analysts build the model, set every assumption and sign off the output. The Resonance Intelligence Engine gathers and structures the underlying source data. It does not produce the forecast and it publishes nothing on its own.
- The build is bottom-up from public-company filings, the disclosed deals in the Quantum Computing Sales Dataset, and analyst estimates for the private vendors, company by company.
- Every scenario is triangulated against 12 published external estimates. The base case has to sit inside that range, and where it does not, the reason is documented in the model.
- Every assumption is yours to change. The assumptions sheet carries a source and a date on each input, so you can rerun the model on your own numbers.
Built and reviewed by the TQI Market Intelligence team.
Sheets and fields
Market data
Long-format table of every modeled value with the 10 fields below.
QC size
Vendor revenue by segment and year, base case.
Scenarios
Bear, base, and bull assumptions and outputs.
QCaaS market
Cloud access model: installs, cumulative users, churn, revenue.
Architecture and geographic revenue
Revenue by modality and by region.
Vendor concentration and installed base
Share by vendor and systems installed.
Company revenue tracker
Reported and estimated revenue for leading vendors.
External triangulation
Twelve published estimates with base year, forecast year, value, CAGR, and method.
Global economic impact
Cumulative and annual economic impact, 2025 to 2035.
Assumptions and sources
Every input with its source and date.
| Field | Type | Description | Example |
|---|---|---|---|
year | integer | Forecast year. | 2030 |
metric | category | Vendor revenue, Economic impact, Installed base, Vendor share. | Vendor revenue |
segment | category | Hardware, QCaaS, Software, Services, Total. | QCaaS |
geography | category | Global, Americas, EMEA, APAC. | Global |
vertical | category | All, Finance, Pharma, Energy, Aerospace, Technology. | All |
scenario | category | Bear, Base, Bull. | Base |
value_usd_m | number | Value in USD millions. | 1810 |
unit | text | USD M, systems, percent. | USD M |
source_sheet | text | Model sheet the value comes from. | QCaaS market |
note | text | Assumption or caveat attached to the value. | 50 percent CAGR from 2025 base |
What the current version shows
As of Q3 2026
As of Q3 2026
As of Q3 2026
As of Q3 2026
How this dataset is built
Sources
- Bottom-up vendor build from public-company filings, disclosed deals in the Quantum Computing Sales Dataset, and analyst estimates for private vendors.
- Top-down triangulation against 12 published estimates from research firms, consultancies, and banks, collected from free landing pages and press releases.
Inclusion rules
- Vendor revenue counts what quantum companies earn from hardware, cloud access, software, and services. It excludes value created for end users.
- Economic impact is modeled separately and labeled as a different layer, never added to vendor revenue.
Validation
- Vendor revenue is cross-checked against the sales dataset and against reported figures for the seven public quantum companies.
- Scenario ranges are stress-tested against the external estimates so the base case sits inside the published range with a documented reason.
Confidence
Every input carries a source and date in the assumptions sheet. Private-company revenue is flagged as estimated.
Known limitations
- Private-company revenue is estimated and can move materially when companies list or disclose.
- Scenario spread reflects uncertainty about fault-tolerant timelines rather than a probability distribution.
- Economic impact uses multiplier assumptions documented in the model and should not be compared with vendor revenue.
What buyers do with it
Board and investor decks
Cite a defensible market size with the scenario range and the reason it differs from headline estimates.
Own-model input
Load the long-format table into your model and change assumptions in the sheets that feed it.
Estimate reconciliation
Use the triangulation sheet to explain why 12 published figures diverge and where each sits.
Versions
- Quarterly refresh. Records, sources and the methodology sheet reviewed.
- Full refresh with 2025 actuals, seven public companies, and 12 external estimates.
- Cross-sector model with top-down and bottom-up triangulation.
- First QC market size and impact report.
Read before you buy
How big is the quantum computing market?
Quantum computing vendors earned about $1.8B in 2025 and reach $5.4B by 2030 in TQI’s base case. How the figure is built and why economic impact differs.
Why do quantum market size estimates differ so much?
Published 2030 estimates for quantum computing range from about $4B to over $20B. The three layers they measure, and how to compare estimates like for like.
A dataset or a platform subscription: which do I need?
Buy a dataset for one verified table at a fixed price. Subscribe to the TQI Intelligence Platform when the question comes back, and get every market report with it.
About this dataset
Both, kept apart. Vendor revenue measures what quantum companies earn. Economic impact measures value created across the economy. The dataset labels each value by metric so the two are never mixed.
Yes. The Excel model ships with its assumptions sheet, so you can alter growth rates, adoption curves, and prices and see the outputs move.
This dataset covers quantum computing. Security and sensing market models are planned as separate datasets.
The triangulation sheet places the TQI base case against 12 published estimates and records each one’s base year, forecast year and method, so you can see why they differ. The full written analysis sits in the TQI market reports, which come with an Intelligence Platform subscription.
Request the Quantum Market Sizing Dataset
Enter your work email and we send the invoice or payment link within one business day. Files follow as soon as payment clears.